Business dashboard template
Financial Dashboard: revenue, profit and margins at a glance
A spreadsheet dashboard for your monthly numbers: revenue, gross profit, net profit and margins, an expense breakdown and a budget-vs-actual table.
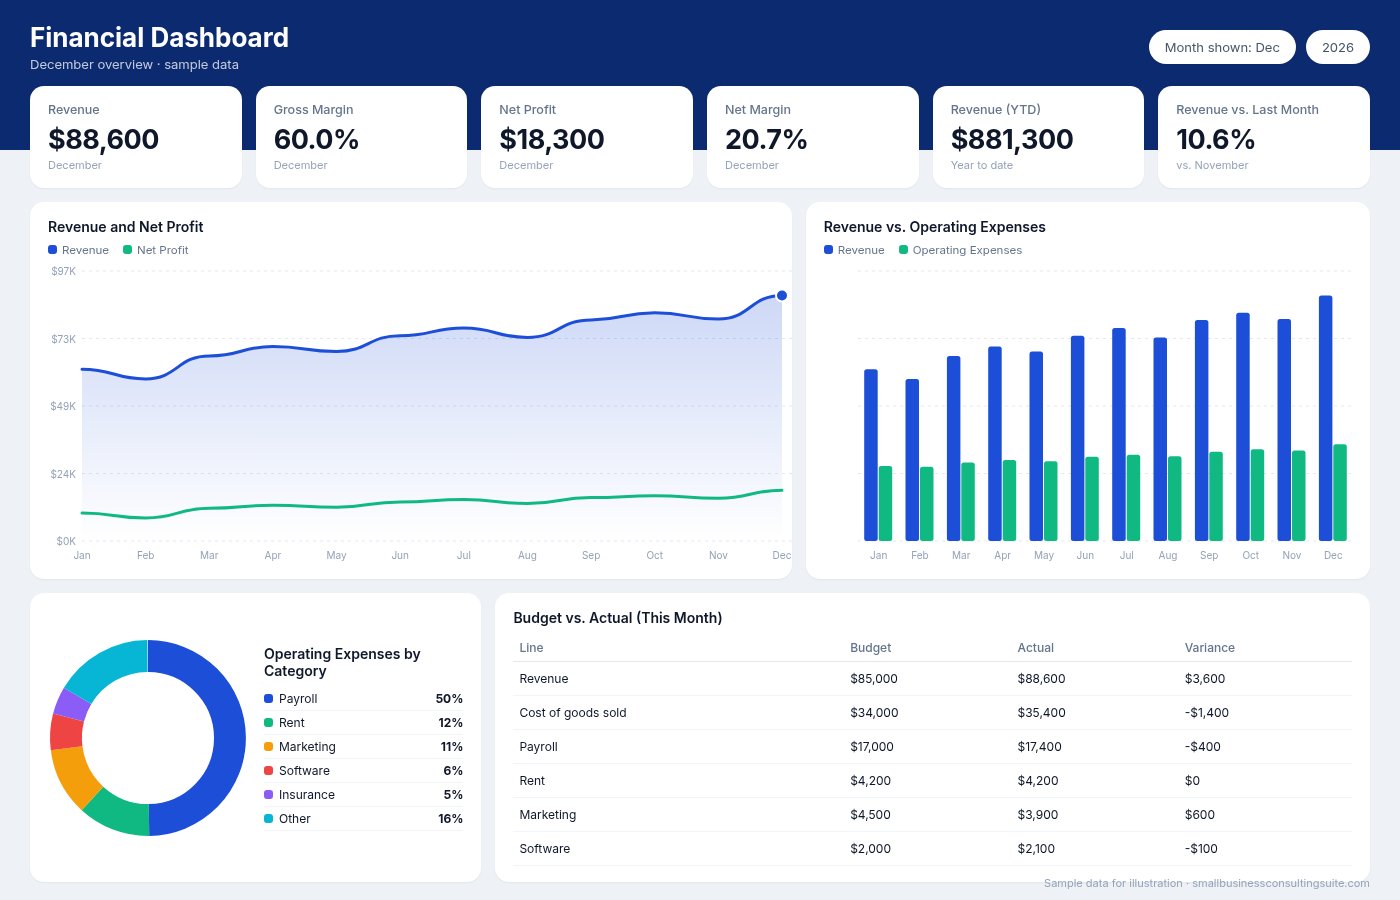
Shown with sample data. Your numbers replace the sample numbers.
What is inside
- Revenue, gross profit and net profit by month
- Gross and net margin calculated for you
- Month-over-month revenue change
- Operating expense breakdown chart
- Budget-vs-actual table with variances
- Tabs: Dashboard, Monthly Data, Breakdown, Log and How to Use
- Pick any month (1 to 12) and every card updates
Who it is for
Owners who want to know each month whether the business is profitable and where the money goes.
How it works
- Check out and download the .xlsx file right away (it is also in your account)
- Open it in Excel, or upload it to Google Sheets
- Type your own numbers over the yellow sample cells
- Set the month on the Dashboard tab and review your numbers
Questions
Does it work in Google Sheets?
Yes. Upload the file to Google Drive and open it with Google Sheets. Formulas and charts carry over; chart styling may look slightly different.
Does it connect to my software automatically?
No. It is a spreadsheet: you type or paste your monthly numbers into the input tabs. That keeps it simple and private.
Are the numbers in the file real?
No. The file ships with sample data so you can see how it works. Replace it with your own.
Want it built and connected to live data instead?
Book a call about a custom dashboard build.
Not sure this is the right one? Take the free 3-minute Dashboard Fit Quiz.
More business dashboards

Accounting Dashboard
Cash, bills and receivables on one screen
$47 · See the dashboard →
Audit Dashboard
Track internal controls, findings and fixes
$47 · See the dashboard →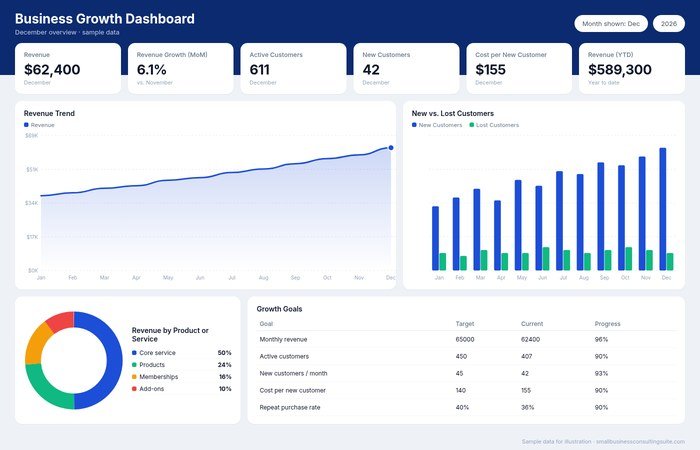
Business Growth Dashboard
See how fast the business is growing
$47 · See the dashboard →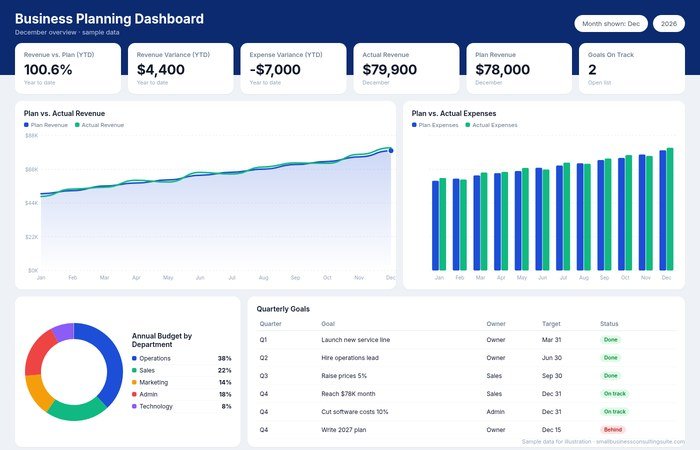
Business Planning Dashboard (Plan vs. Actual)
Your annual plan vs. what actually happened
$47 · See the dashboard →